
2.1.1Do I have enough gas?
Area Under a Curve Using Trapezoids
Elena and J. T. are cruising at
Time (seconds) | |||||||||||||
|---|---|---|---|---|---|---|---|---|---|---|---|---|---|
Velocity (ft/seconds) |
Sketch a velocity graph using the data shown in the table above.
Describe how the velocity is changing. When is the velocity changing the fastest? The slowest?
Approximately how far did the car travel in the first
seconds? Use a trapezoid to approximate the distance traveled for . With the data provided, use trapezoids to approximate the total distance traveled by the car after it ran out of gas. It is important to show your work in a systematic and organized way.
Did the car reach the gas station before stopping? If not, how far did Elena and J. T. have to walk?

Sketch a scatterplot of the data below.
“Connect” your scatterplot so that
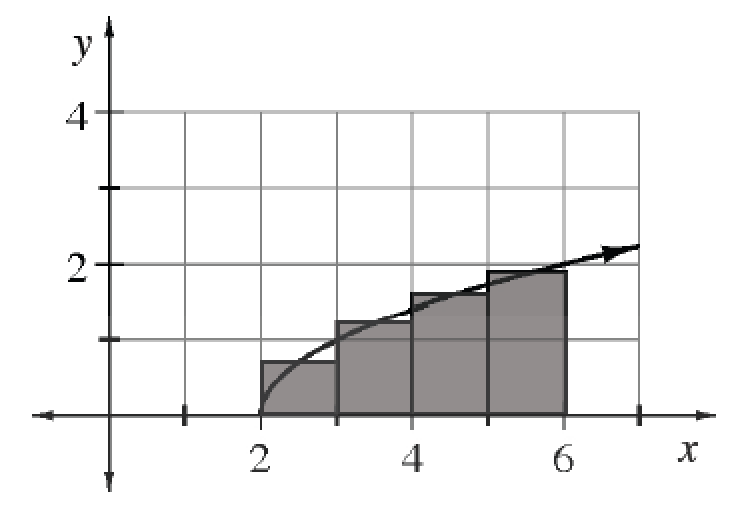
becomes a continuous function. Is there more than one way to do this? Explain. Use five trapezoids to approximate the area under
on . Organize your steps systematically. Tristin organized his work like this:
Why does the fraction
keep recurring throughout this equation? Simplify Tristin’s equation by “factoring out” the
. Describe any new patterns you see.
Use the Trapezoid Rule in the following Math Notes box to set up and compute an approximation for the area under
using four trapezoids of equal height.

The Trapezoid Rule
The Trapezoid Rule can be used to approximate the area under a curve if the widths,
.png)
In previous problems, approximating the area under a curve required adding the areas of many rectangles or trapezoids together. Imagine the work required to write down the expression if
Summation Notation
The capital Greek letter sigma,
Translated, this expression means the sum from
Note: We call
HELP!
Your teammate wrote the expansion for the sum below. Explain what was done incorrectly in this expansion.
Realizing that their first expansion was incorrect, your teammate tried again. Explain what was done incorrectly this time.
Demonstrate how to correctly expand and simplify this sum.
Rewrite each of the following sums using summation notation.
Hooree is learning to hula-hoop. Using a tachometer, her coach keeps a record of her hula-hooping rate (rotations per minute) at select times.
Time (minutes) | |||||||
|---|---|---|---|---|---|---|---|
Rate (rotations per minute) |
Sketch a graph of Hooree’s rate.
Find a way to approximate the number of rotations she makes during the
-minute period. It is important to show your method in a systematic, organized way. Do you think your approximation was over or under the actual number? Explain.
What appears to be happening to Hooree when
?

Consider the function
Sketch a graph of the function. Label any holes or asymptotes.
Write an equation for the inverse of
. Is the inverse a function? Why or why not? Sketch a graph of the inverse and compare this sketch to the graph of
from part (a).
The shaded region at right represents a flag (the upper boundary is a semi-circle). Calculate the volume of the solid formed when the flag is rotated about the pole. In a complete sentence, describe the rotated shape. To help you visualize this, use the 2-8 HW eTool. Homework Help ✎
.png)
For
Recall that the area between a function and the
Expand and evaluate each of the following sums. Homework Help ✎
Determine whether each function below is an even function, an odd function, or neither. Homework Help ✎
A bug is walking on your graph paper along the
When did the bug turn around?
When was the bug’s speed the greatest?
After
seconds, how far is the bug from its starting position? Remember that acceleration is the rate of change of velocity. Calculate the acceleration of the bug at the following times.
second
seconds
seconds
.png)
Let
What is
? As
? As
? What do the results from parts (b) and (c) indicate about the graph?